Reporting
Burndown chart
Studio
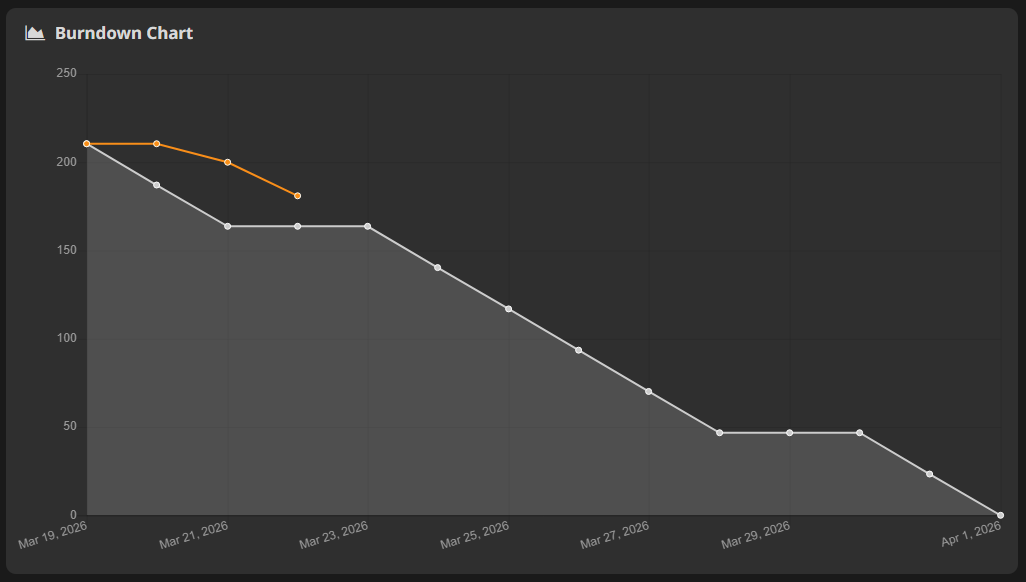
The burndown chart visualizes planned versus actual sprint progress over time.
HacknPlan calculates this using board dates plus either effort values (time/points) or item counts.
Open it from:
Reports -> Burndown chart
Chart options
- Mode:
- Cost: estimated and logged effort
- Items: open vs closed item counts
- Both: effort and item lines together
- Board: selected board to analyze
Ideal line
The ideal line represents a linear path from initial scope to zero by board due date.
Interpretation:
- progress line above ideal: behind plan
- progress line below ideal: ahead of plan (or overestimation)
The goal is not only speed, but estimation reliability. Staying close to the ideal line usually indicates healthy planning quality.
Burndown calculations respect project timetable settings (for example, weekends/non-working days).
Configure timetable in:
Administration -> Timetable