Reporting
Gantt chart
Studio
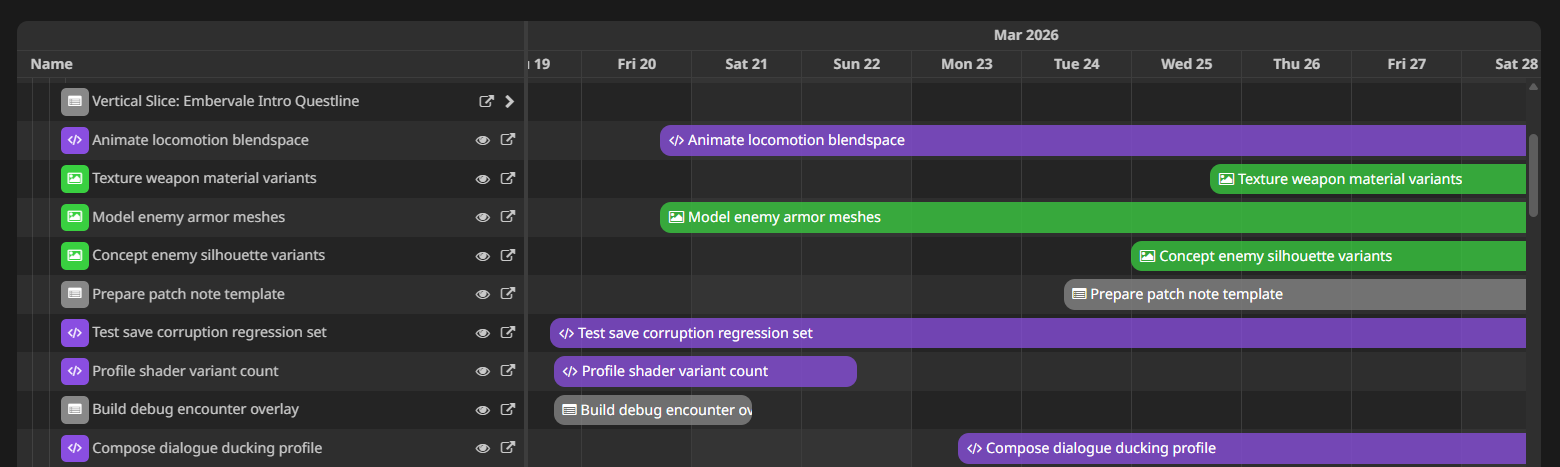
HacknPlan includes a Gantt chart for timeline planning and schedule tracking.
The chart displays work items on a time axis so you can review start dates, durations, and end dates in one consolidated view.
Open it from:
Planning -> Gantt chart
Chart configuration
- Mode:
- User: Displays work items per asignee
- Board: Displays work items grouped by board and milestone
- Design element: Displays work items grouped by design element
- Scale:
- Hour
- Day
- Month
- Filters:
- Show closed items: Shows/hides work items that are closed
- Show items without dates: Shows/hides work items without both start and due date set
Editing dates from the chart
You can adjust item schedules directly:
- Drag bars to move or resize date ranges of items
- Create date ranges for undated tasks by double clicking on the lane
- Delete date ranges from an item by selecting it with a click and pressing
Delon your keyboard
Additionally, you can perform the following operations:
- Scroll to the existing start date of an item by clicking on the eye icon on the row, or double clicking on any empty space of the lane
- Scroll by dragging the background
Upcoming changes
Edition in the current version of the Gantt Chart is limited, but we are working on a brand new version built from scratch that will include:
- Creation, update and deletion of items directly on the Gantt row panel.
- Manual sorting of items using drag and drop.
- Dependencies visualization and edition using drag and drop.
- Item visualization and edition on a side panel.
- Multiselection and batch edition.